Sending Custom ETL and BI Traces to Datadog APM
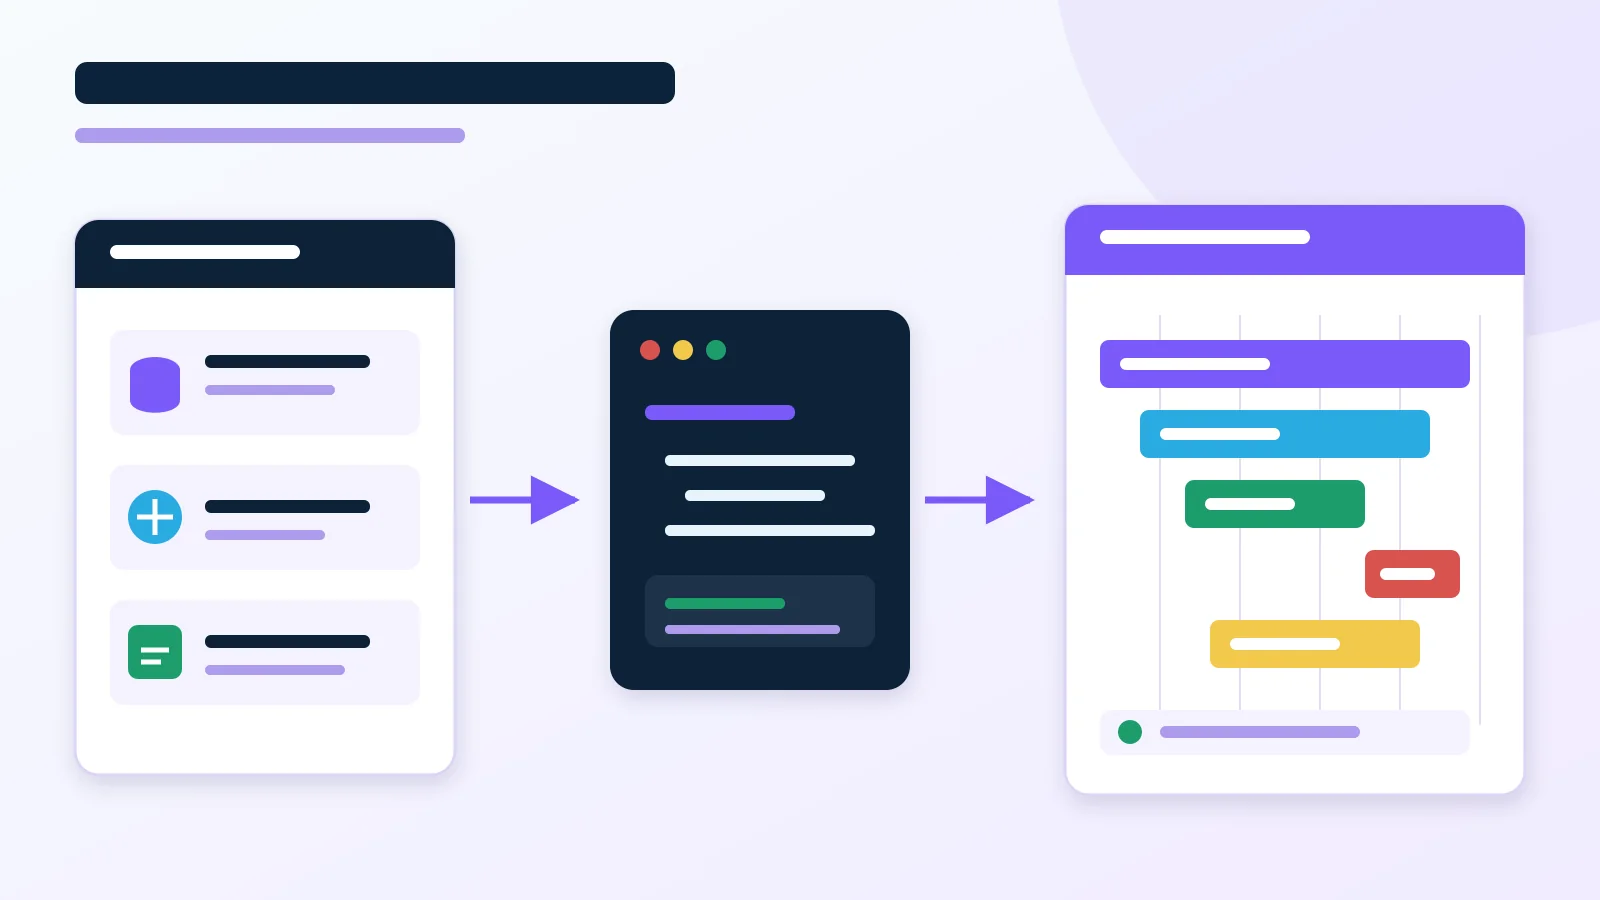
Datadog APM is primarily associated with monitoring backend applications. A trace begins with an HTTP request, and subsequent spans show calls to services, databases, and external APIs.
The situation is different in data projects. An ETL process may run in a data warehouse, a managed service, or an external processing engine where a tracer cannot be attached. Usually, all that is available is execution history: a job identifier, start and finish times, status, and an error message.
These records can be polled periodically and sent to Datadog as custom traces and spans. This lets data and BI teams see not only the number of errors, but also:
- the total time from starting the pipeline to refreshing the report;
- the duration of each extraction, transformation, loading, and waiting stage;
- the queries or jobs slowing down the entire process;
- dependencies between the pipeline, warehouse, and BI layer;
- where and why processing stopped.
When to send data processes as traces
This approach makes sense when:
- the ETL engine or warehouse exposes execution history but does not allow direct instrumentation;
- each record includes at least the job’s start time, finish time, and status;
- the complete processing path matters, not just an individual measurement;
- the team wants to analyze stage durations in a flame graph and quickly find the cause of delayed reports.
If you only need a chart of one job’s execution time, a metric sent through DogStatsD is simpler. Traces are most useful when a process consists of multiple related stages (spans).
Retrieving execution history
A collector can poll a system table, an orchestrator API, or a job log every minute. Regardless of the source, it is useful to normalize records into a common model:
from dataclasses import dataclass
from datetime import datetime


@dataclass()
class JobExecution:
    execution_id: str
    pipeline_name: str
    query: str
    job_name: str
    started_at: datetime
    finished_at: datetime | None
    status: str
    error_message: str | None = None
    rows_processed: int | None = None
Sending a completed job as a span
Following Datadog’s custom instrumentation guide, ddtrace lets you set a span’s actual start and finish times. A span can therefore describe a job that previously ran in an external system.
from ddtrace import tracer


def send_job_span(job: JobExecution) -> None:
    if job.finished_at is None:
        return

    span = tracer.start_span(
        "etl.job",
        service="data-platform",
        resource=job.job_name,
    )
    span.start = job.started_at.timestamp()
    span.span_type = "worker"
    span.set_tag("pipeline.name", job.pipeline_name)
    span.set_tag("job.execution_id", job.execution_id)
    span.set_tag("job.status", job.status)

    if job.rows_processed is not None:
        span.set_metric("rows_processed", job.rows_processed)

    if job.status == "failed":
        span.error = 1
        span.set_tag("error.type", "SomeType")
        span.set_tag(
            "error.message",
            job.error_message or f"Job {job.execution_id} failed",
        )

    span.finish(finish_time=job.finished_at.timestamp())
It is worth distinguishing the meaning of the main fields:
serviceidentifies the platform or logical system, such asdata-platform;- the span name describes the type of operation, such as
etl.joborwarehouse.query; resourceidentifies a stable job name, such astransform_sales;- tags store the execution identifier, pipeline name, status, and other diagnostic data;
- span metrics store numeric values, such as the number of processed rows.
A failed job is recorded by setting span.error = 1, which feeds Datadog’s error tracking for APM.
Building one trace for the entire pipeline
The greatest value comes from connecting every stage of one pipeline run. The root span describes the pipeline, while the spans for individual jobs are its children.
In a production implementation, records must be grouped not only by pipeline name, but primarily by the identifier of a specific run. Otherwise, stages from several concurrent runs may end up in one trace.
Connecting ETL to a BI report
If the BI tool records the pipeline run identifier or inherited Datadog context, the dataset refresh can be attached to the same trace. This makes it possible to determine whether a report was delayed by data transformation, warehouse loading, or the BI model refresh itself.
Trace context can be carried in job metadata, an audit table, a pipeline parameter, or an SQL comment:
The collector can reconstruct the identifiers with the Datadog propagator:
from ddtrace.propagation.http import HTTPPropagator


parent_context = HTTPPropagator.extract(
    {
        "x-datadog-trace-id": str(trace_id),
        "x-datadog-parent-id": str(span_id),
    }
)

span = tracer.start_span(
    "warehouse.query",
    service="data-warehouse",
    resource=query_name,
    child_of=parent_context,
)
If a custom integration format stores only 64-bit decimal identifiers, both sides must use a compatible trace ID format. Do not automatically disable 128-bit identifiers across the entire organization. First, verify the format propagated by the library versions in use and how the context is stored.
Limitations
- The collector does not observe work live; it reconstructs it from execution history.
- Delayed polling means that traces also appear in Datadog with a delay.
- The Datadog Agent and backend may reject data that is too old, so collector lag must be monitored.
- Every record converted into a span increases APM data volume. Not every technical step needs its own span.
- Polling the same completed record again may create a duplicate. The collector should remember the last processed timestamp or the identifiers of sent executions.
- A trace does not replace an audit table. Datadog supports observability and diagnostics, while the source system remains the authoritative record of complete process history.
If the solution needs to remain vendor-neutral, the same model can be built with the OpenTelemetry Python SDK. Datadog accepts OTLP data, so the way pipelines are represented does not have to remain permanently tied to ddtrace.